
TL;DR ⚡
What you’ll learn: A new, time-dependent approach to measuring Solana validator rewards by comparing performance with neighbouring leaders instead of relying on misleading cluster averages.
Why it matters: Precise, per-slot reward tracking enables data-driven validator optimization and reveals real performance dynamics hidden behind epoch-level averages.
Exo Edge: At Exo, we actively apply these practices via benchmarking TPU traffic, analyzing efficiency gaps, and fine-tuning validator performance. This ensures a robust, future-ready infrastructure for both our operations and any clients built on our stack.
Introduction
One of the primary motivations for running or improving a Solana validator client is to maximize rewards. The first step toward achieving this goal is accurate measurement, which involves understanding how your validator is truly performing.
Today, most methods used across the ecosystem fail to produce consistent insights. For example, even with identical configurations, two validators can show noticeably different rewards across epochs. The root cause lies both in what we measure (the metrics themselves) and in the dynamics of the leader turn, specifically, the controlling factors that influence reward performance.
In this post, we’ll explore a new, time-dependent method for measuring block rewards that gives a more realistic, repeatable view of validator performance. Ultimately, we’ll also propose what could serve as the gold standard for measuring validator efficiency.
At Exo, this is the framework we use internally to assess our validator, and it has already surfaced key insights for our infrastructure.
Background: Two Types of Rewards
Broadly, Solana validator rewards fall into two categories:
Inflationary Rewards
Block Production Rewards
These differ in volume, variance, innovation potential, and controlling factors.
Reward Type | Volume (% APR) | Variance | Innovation Potential | Controlling Factors | Future Trend |
|---|---|---|---|---|---|
Inflationary | 6.47–6.49 | Very low (±0.05 APR) | Low | Voting latency, Hardware tuning and Geographical location | Will decline with decreasing inflation |
Block Production | 0.35–0.65 | Very high (up to 2x) | High | Stake, Validator client. Geographical location and Leader time period | Will increase with more demand and increasing CU capacity |
[Reference: P2P Validator Dashboard]
While most of the total reward volume comes from inflationary rewards, two key points stand out:
Voting rewards barely vary — leaving little room for optimization.
Since many validators operate with 0–10% commissions, the net gain from voting rewards often approaches the block production rewards, which depend entirely on the leader's performance.
👉 Takeaway: The real differentiator in validator profitability comes from how efficiently you perform during your leader slots, making block production rewards the true performance frontier.
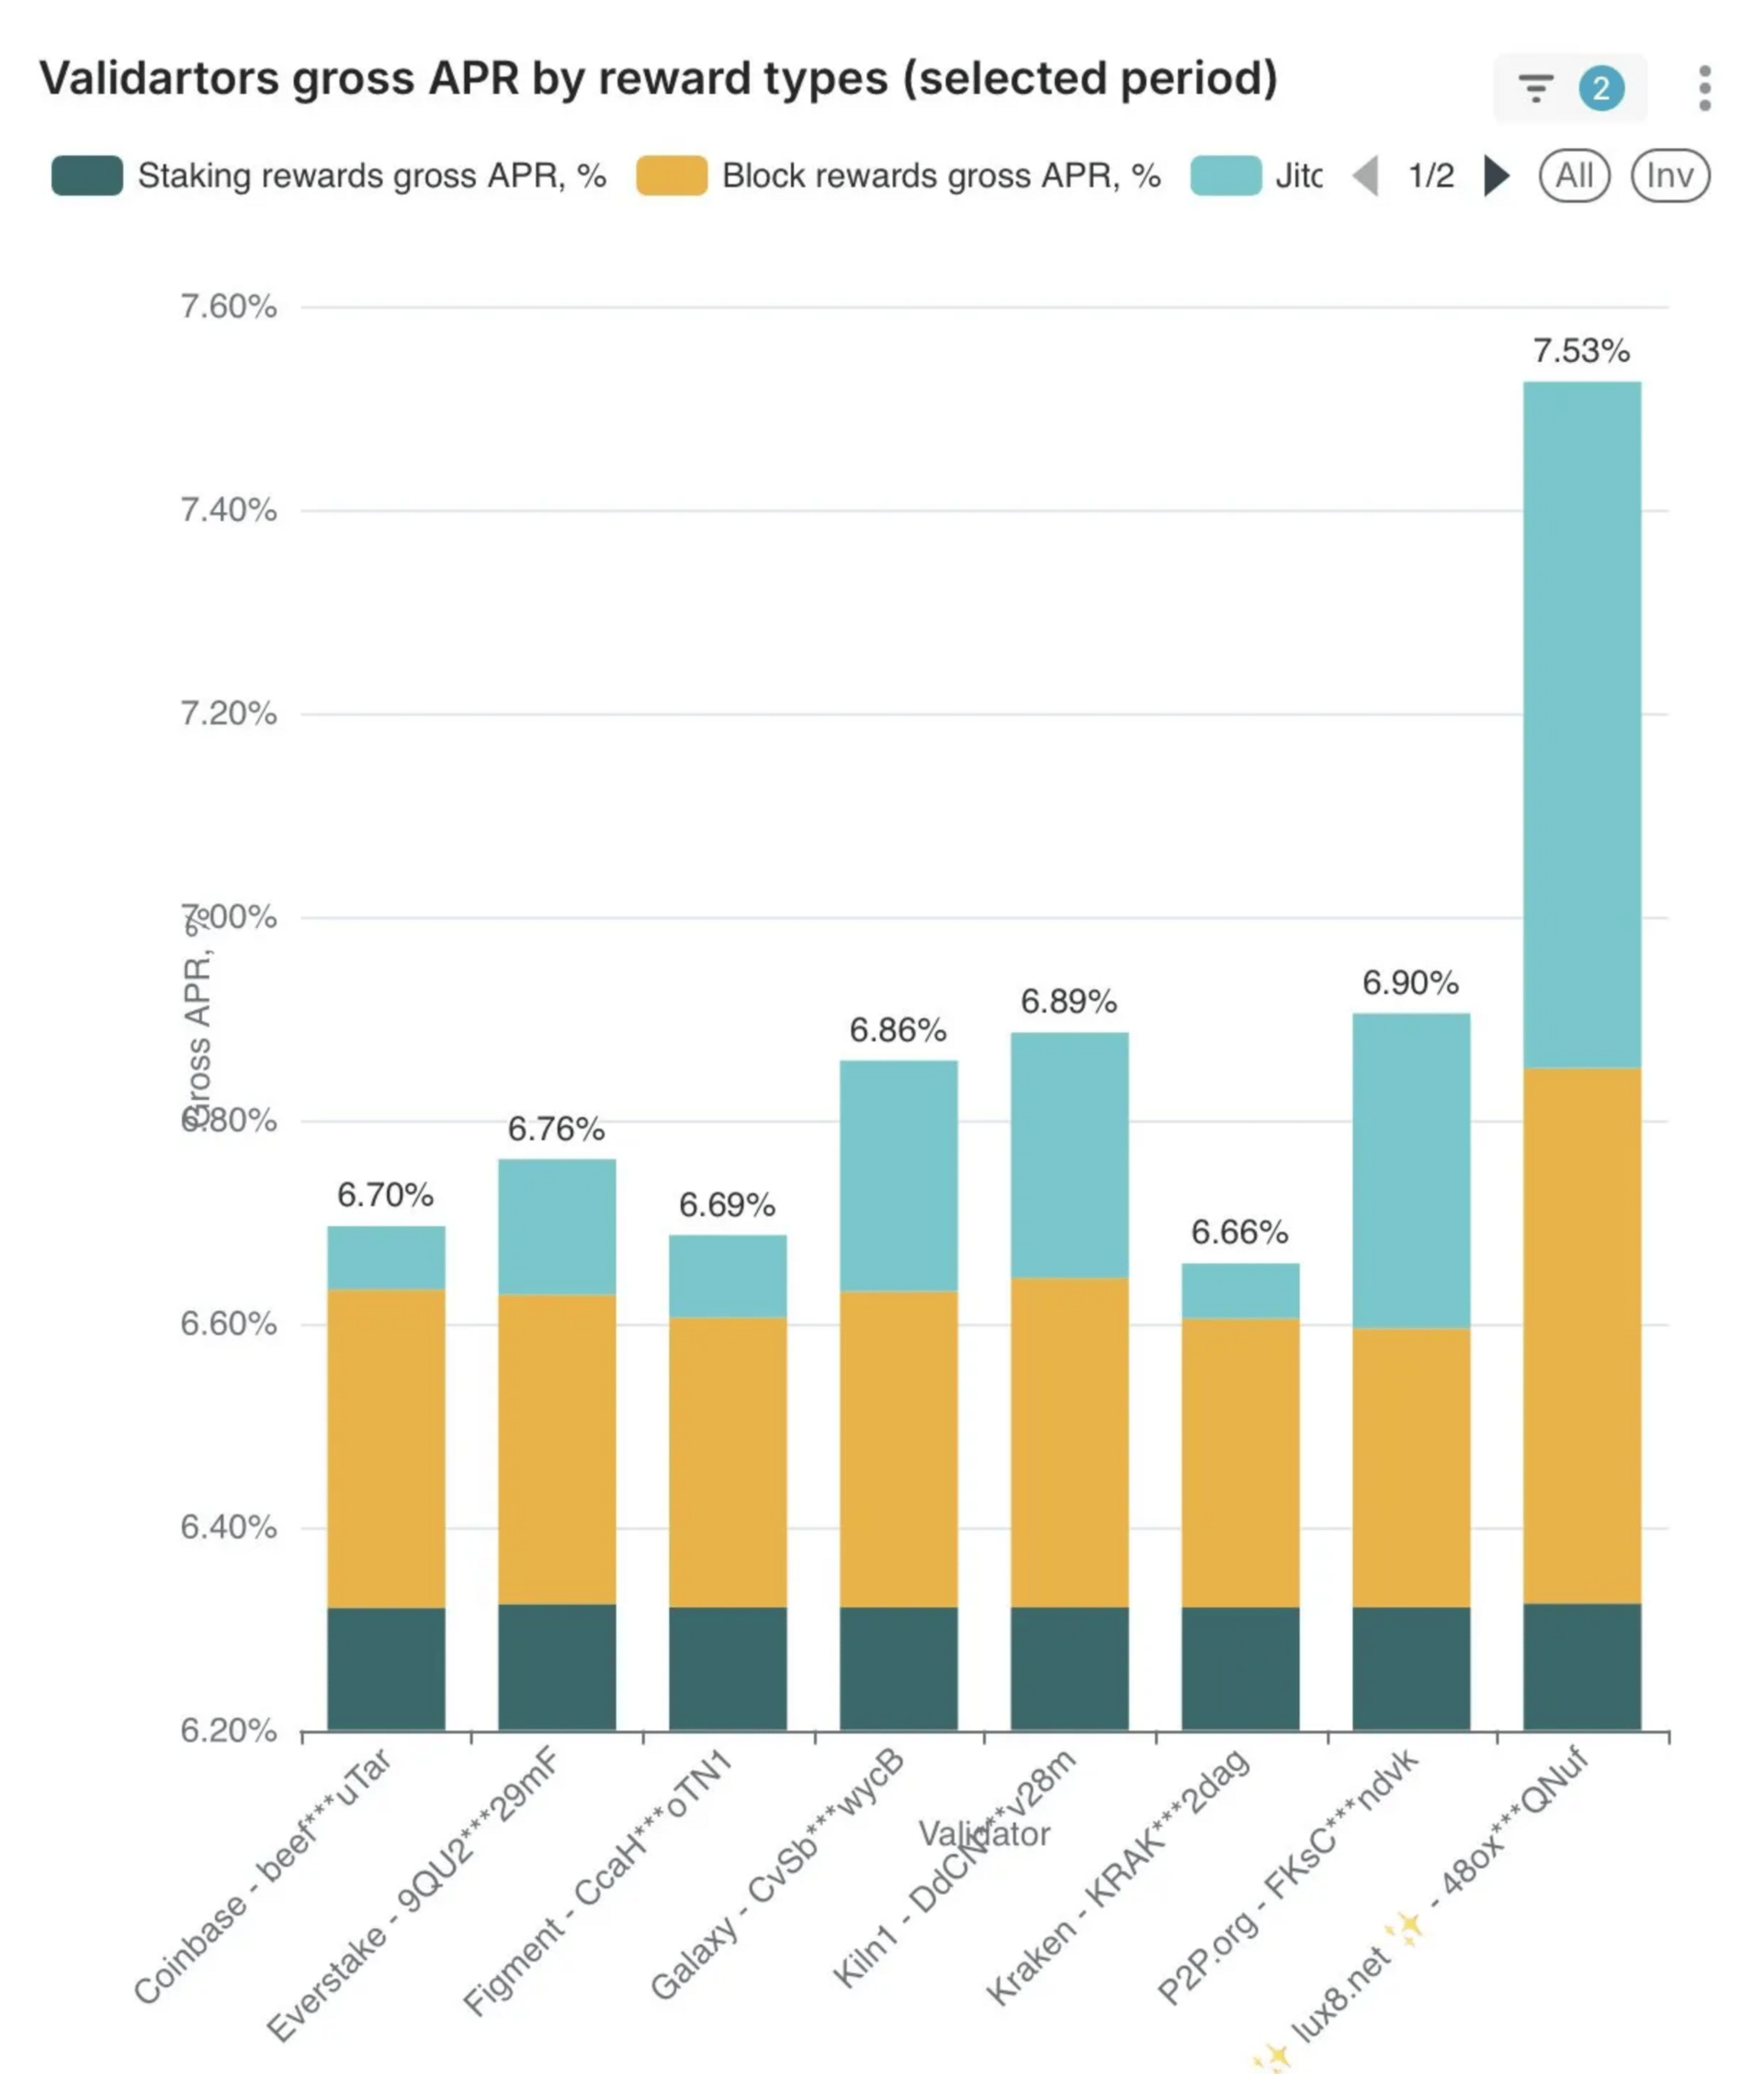
Notice that inflationary rewards remain constant, while block rewards (tips + priority fees) are the main differentiator — in some cases varying by up to 2×. (Ref: [source here])
The Problem with Current Reward Tracking
Most dashboards and APIs today present average or median reward data over epochs. While some provide filters for stake or client type, relying on averages is misleading because traffic patterns fluctuate heavily throughout the day.
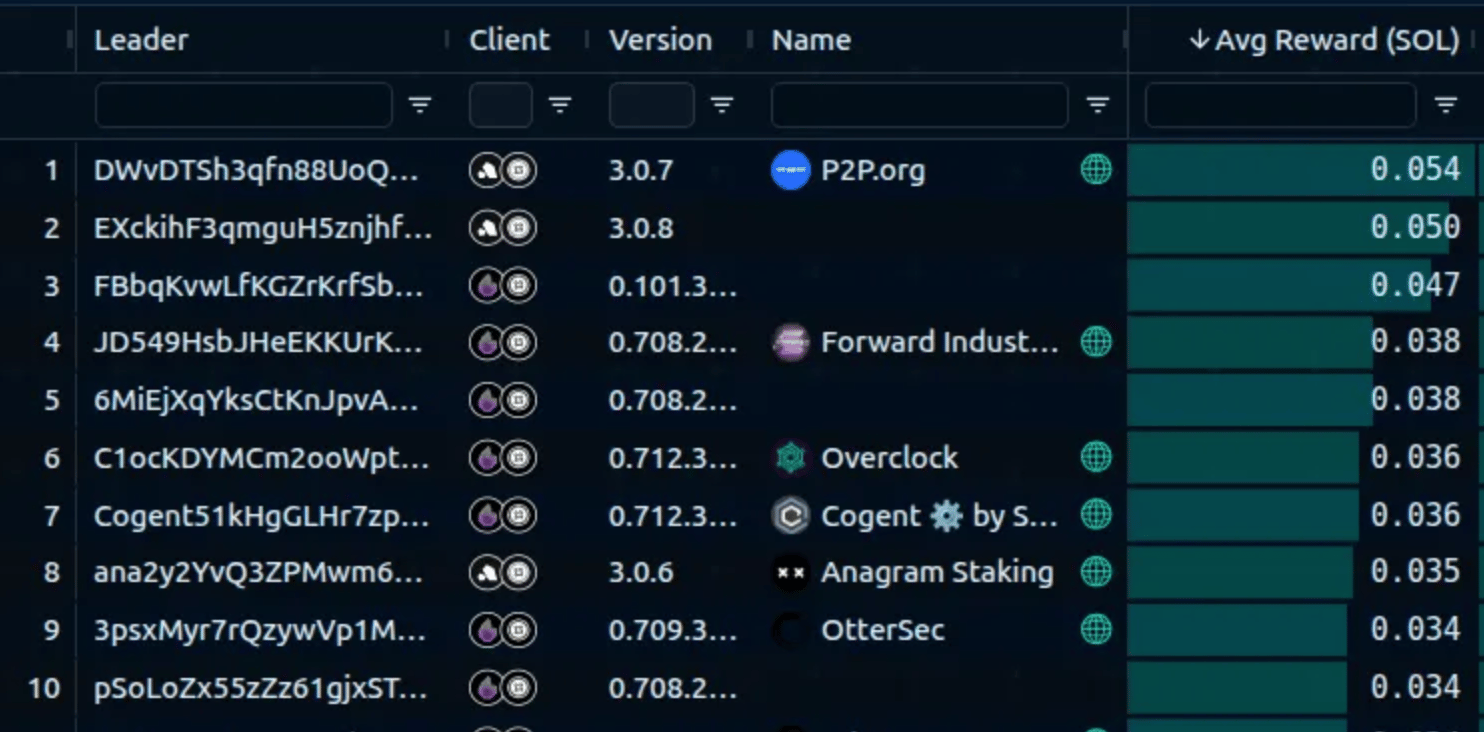
Avg Reward represents the average of (tips + priority fees) over several epochs, which masks the time-dependent nature of network traffic.
Even with filters applied, these averages don’t reflect the randomness of the leader schedule or the time-dependent nature of network traffic — making it difficult to fairly compare one validator to another.

These are our validator’s leader turns — notice the clear time dependence in the rewards generated.
Another limitation:
There’s no direct RPC method to calculate per-block rewards. The usual workaround involves fetching blocks manually (getBlock) and iterating through every transaction to sum fees and tips (ref: here) — a process that’s slow and compute-heavy.
Time-Dependent Tracking: A Fairer Method
Instead of comparing against cluster-wide averages, a validator should measure itself against its neighboring leaders.
If your validator’s leader slot is X, your neighbors are defined as (X − N) and (X + N) — where N is the number of adjacent slots to analyze (e.g., ±20).
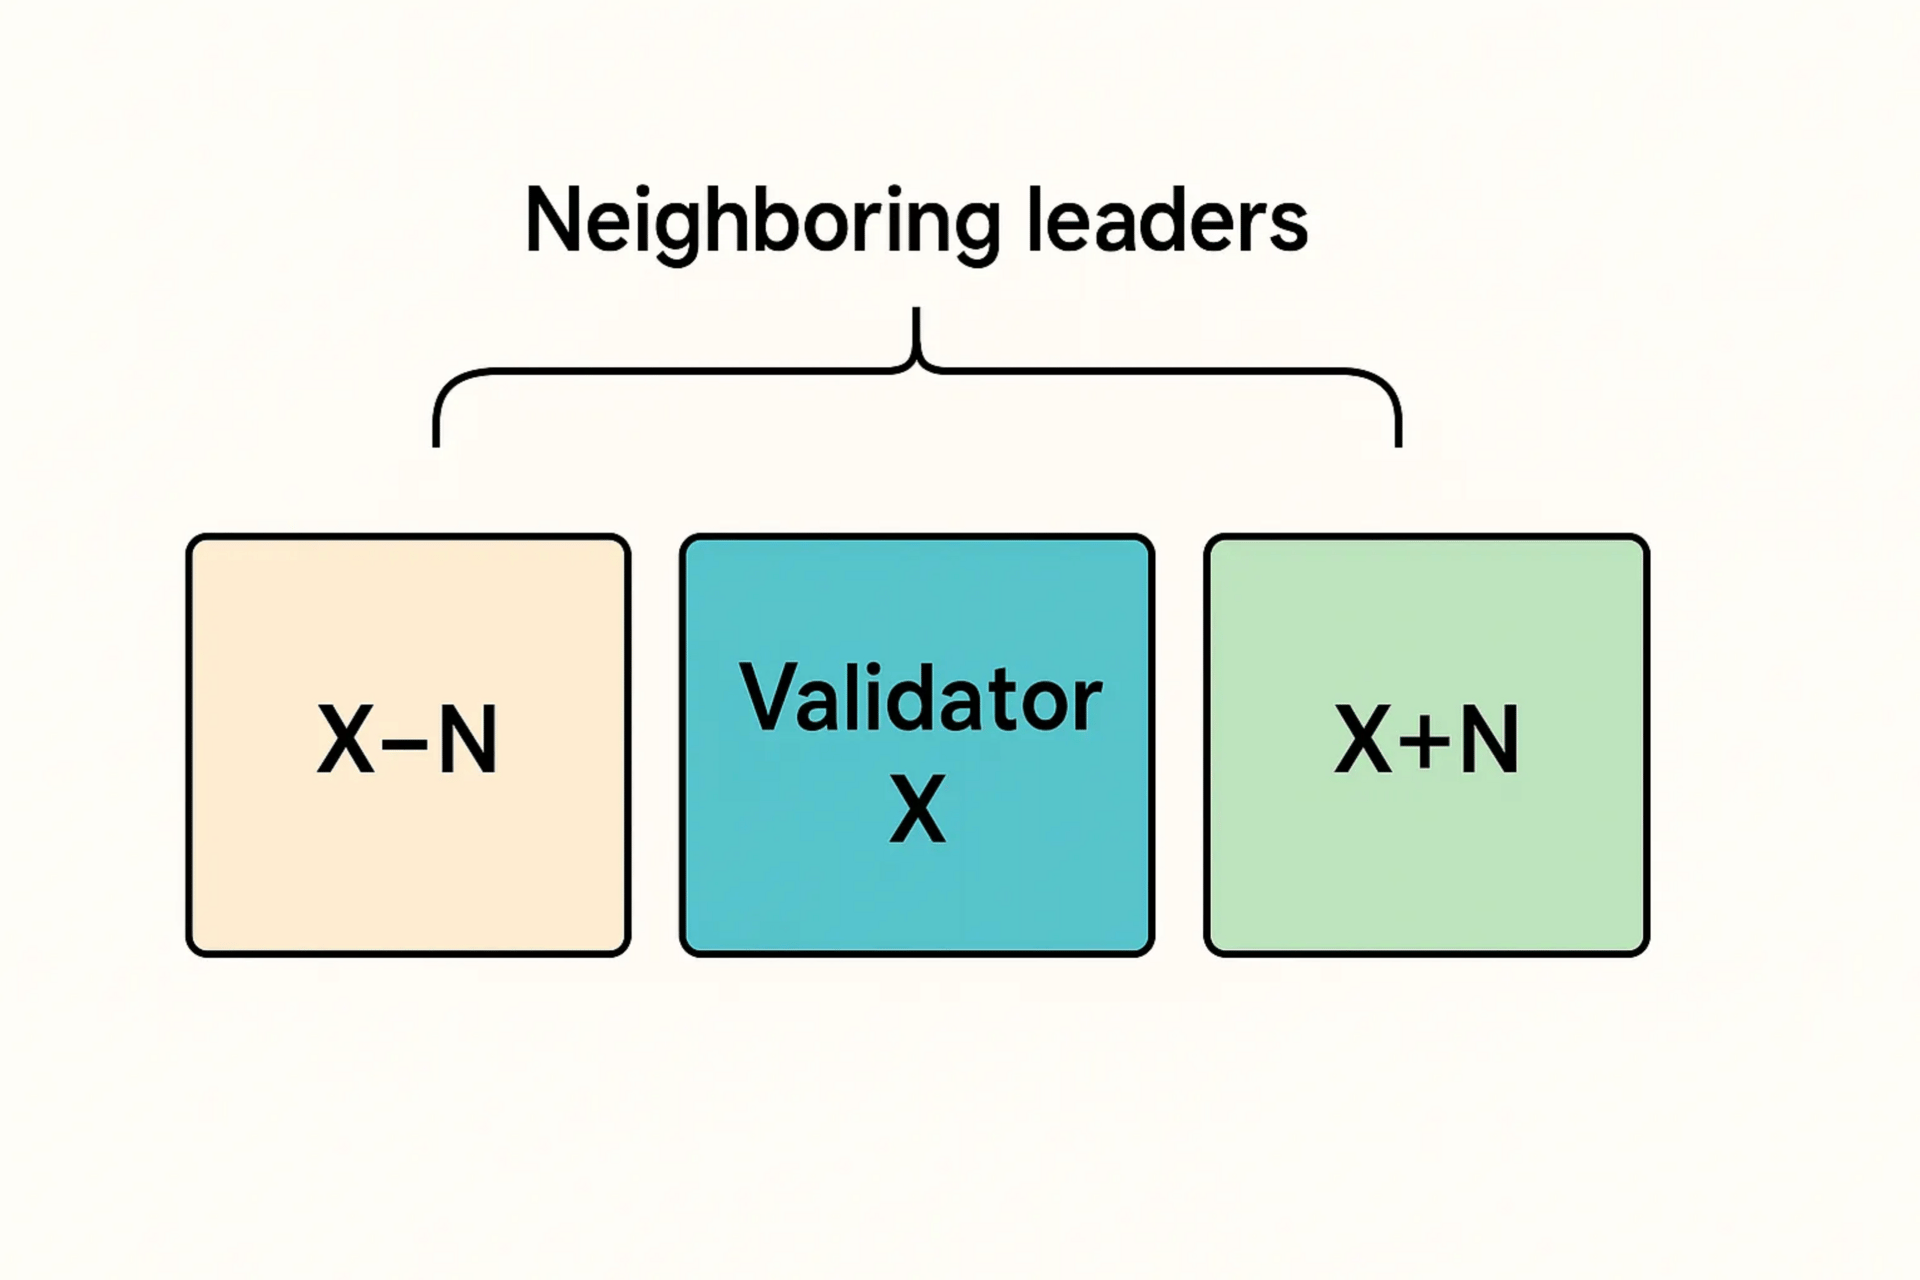
The assumption is that adjacent leaders experience similar network conditions, so comparing within this narrow time window minimizes external bias while preserving real performance differences.
Steps to Implement
Identify your leader slots and the adjacent neighbors (e.g., ±20).
Fetch block data for all these slots (
getBlock).Calculate rewards and tips by iterating through transactions.
Compute averages for your leader slots and for the neighbors i.e one average per turn.
Compare your average reward per block for your turn with the median of neighboring leaders.
👉 Outcome: You’ll get a much more representative and fair performance comparison, reflecting true validator efficiency rather than broad cluster noise.
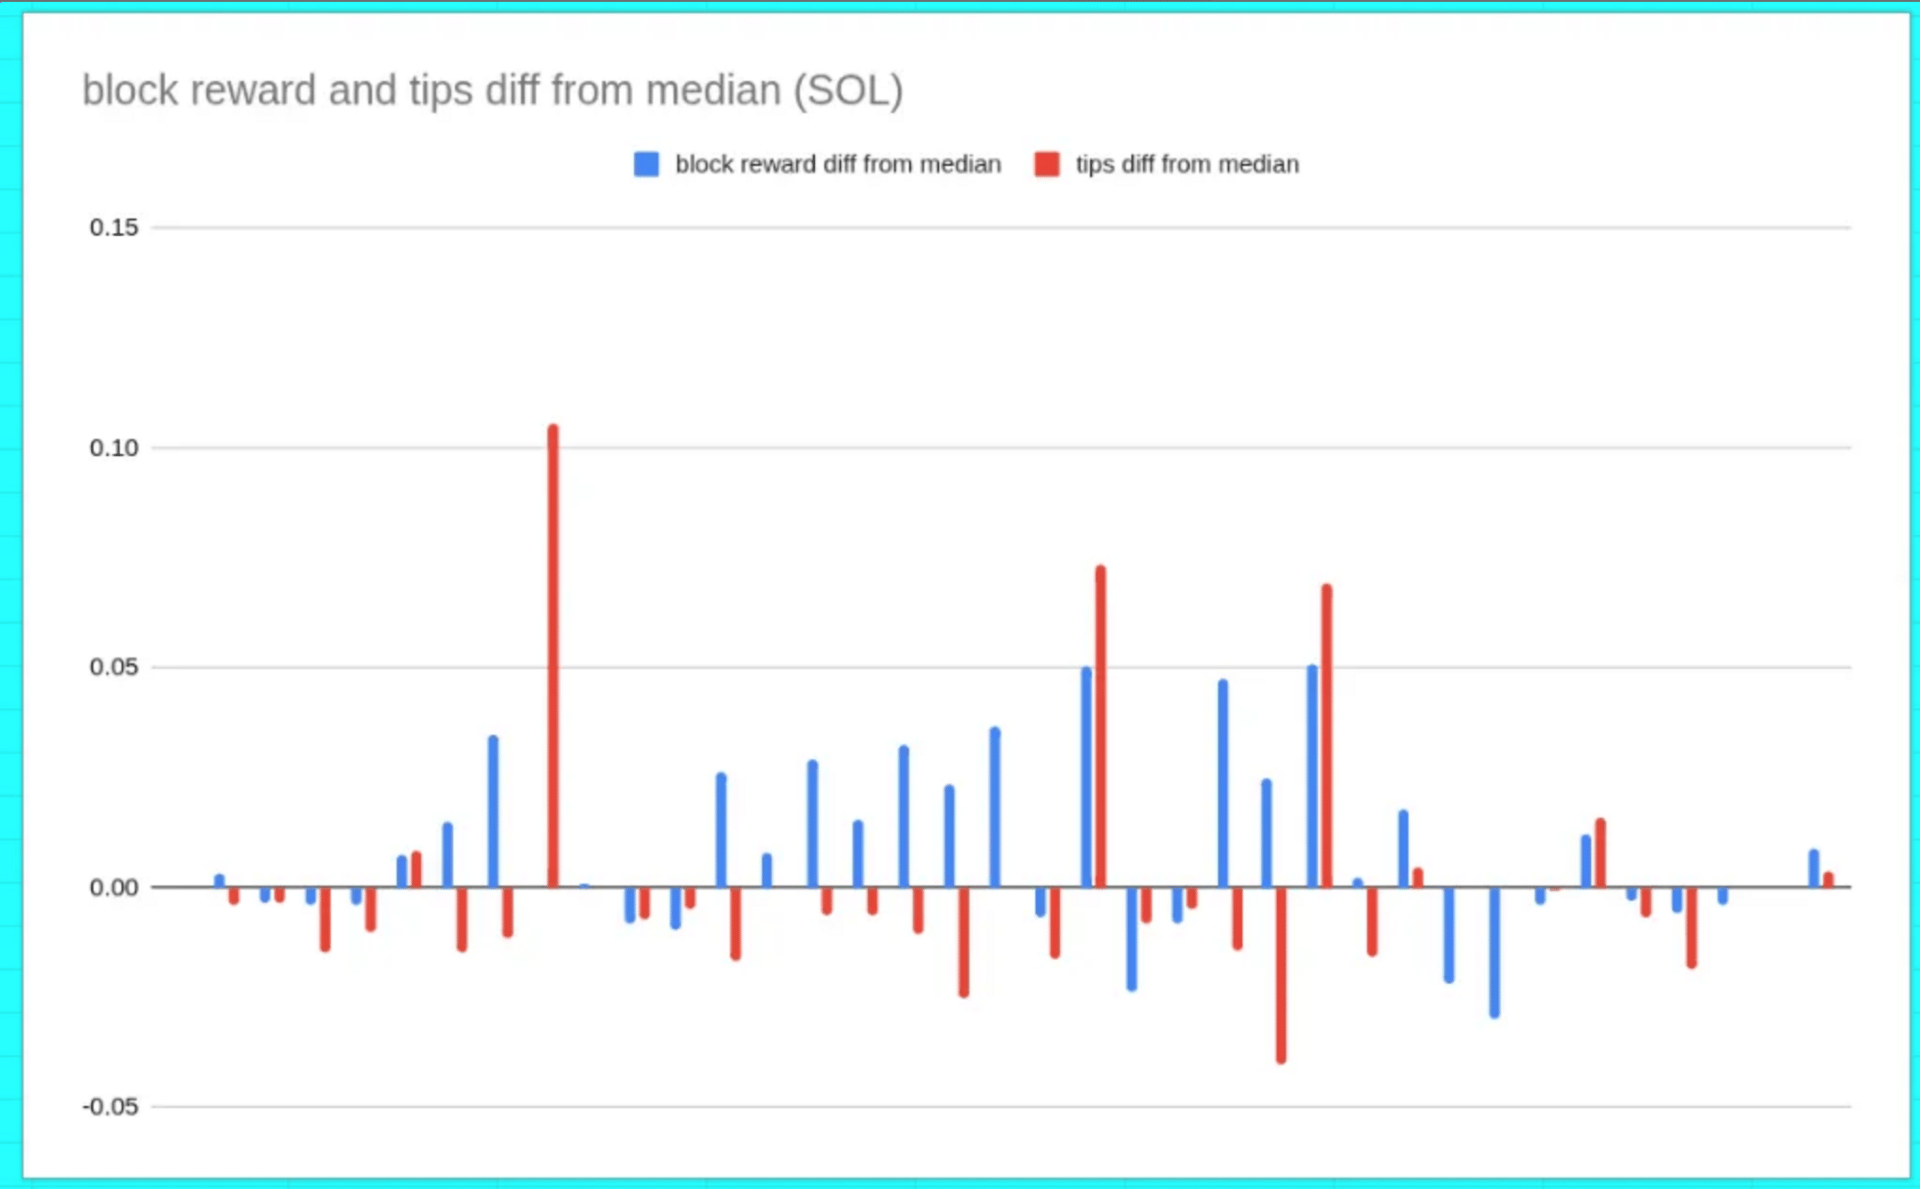
Absolute difference between tips and block rewards compared to the median.
Other Controlling Factors
Even after time-normalizing the analysis, stake, client type, and geographical location remain influential variables. These should be used as filters for further classification.
1. Stake
More stake means more frequent leader turns, which helps in two ways:
Traffic continuity: Validators with close leader slots maintain momentum in incoming traffic, using residual transactions more effectively.
Attractive routing: High-stake validators receive preferential routing (and special deals 😎**)** from transaction landing services.
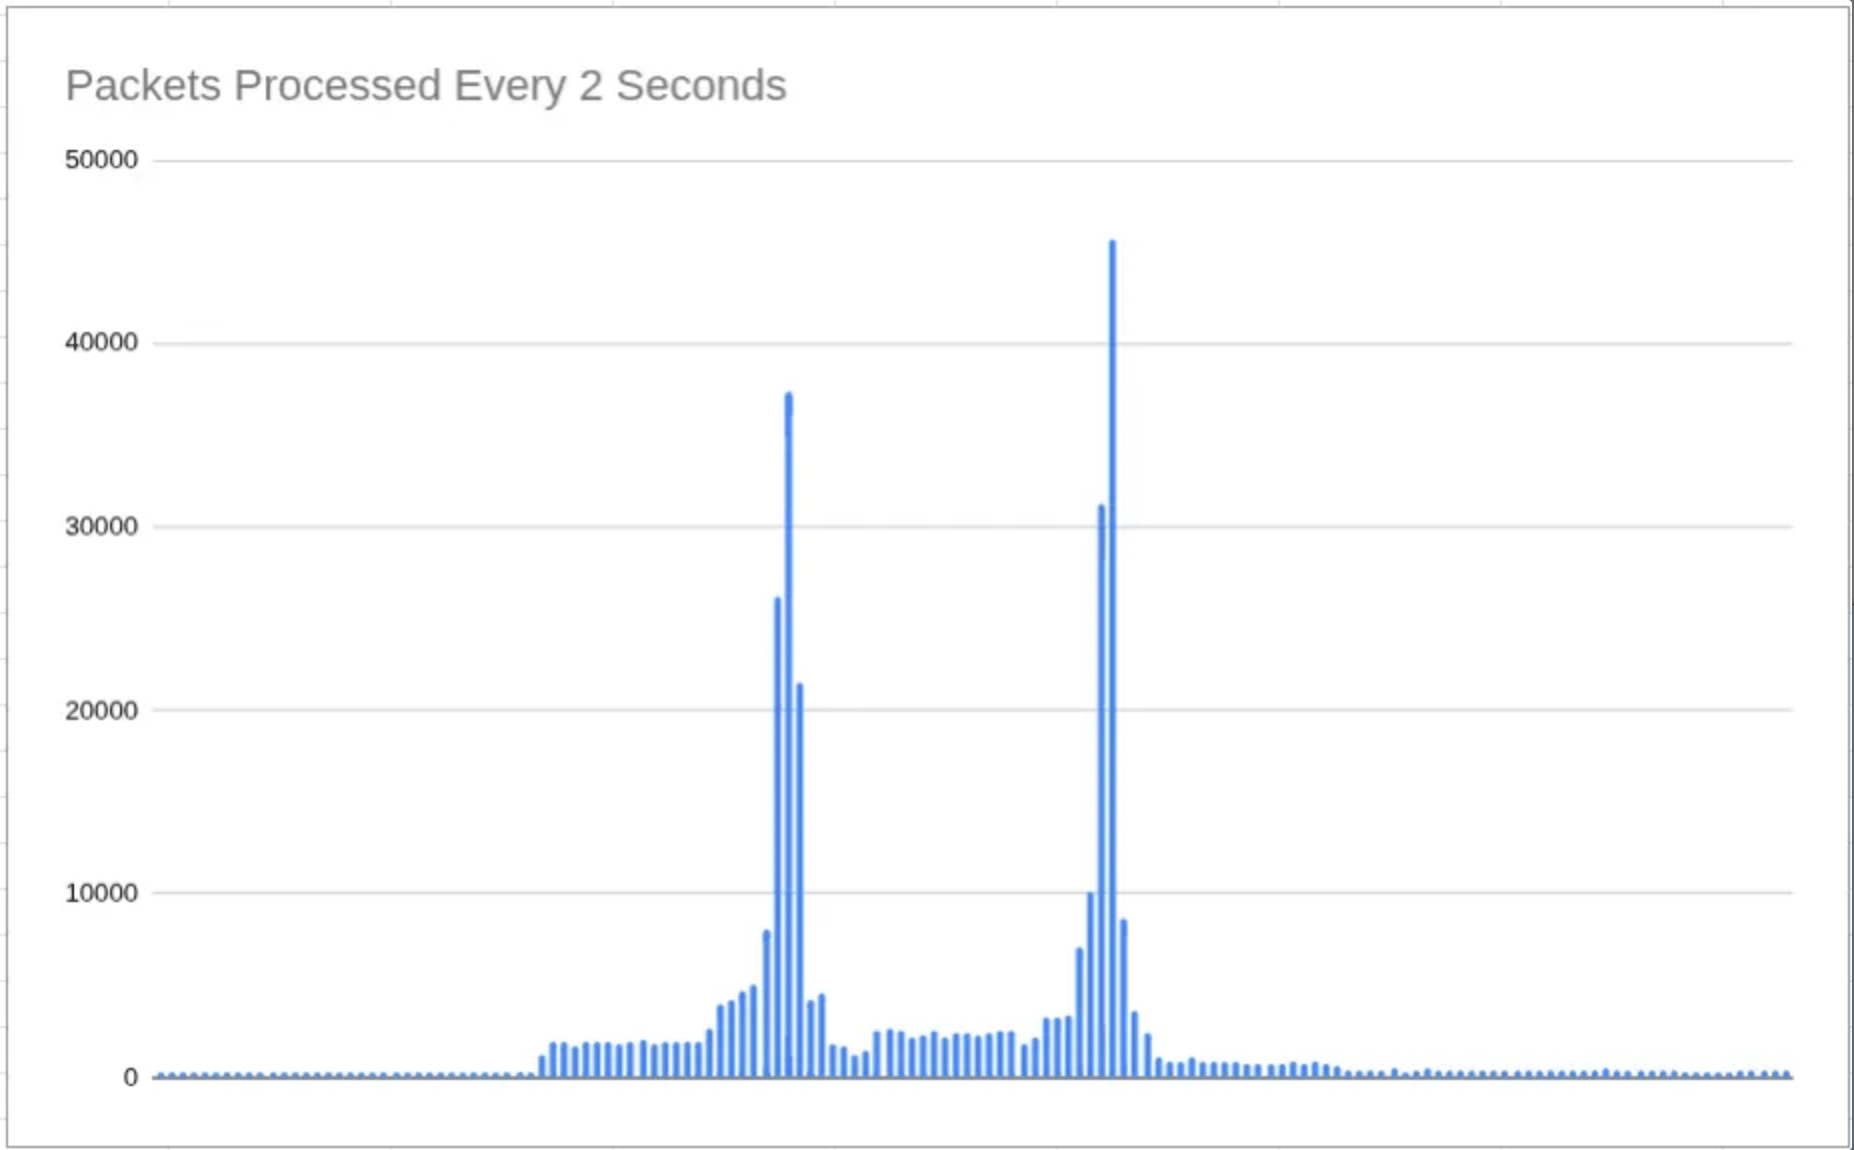
This shows that when leader turns are close together, the second turn benefits from the residual traffic of the first.
2. Client Type
Solana has two major client families: Firedancer and Agave, each with distinct schedulers and TPU architectures.
Agave also includes multiple forks with unique order-flow optimizations:
Jito — Parallel Bundle TPU + BAM (Block Engine Assisted Mempool)
Pladin — Dedicated p3 port for order flow
Rakurai — Custom closed-source scheduler
These architectural differences directly influence transaction prioritization and reward yield.

Clients’ distribution
3. Geography
Location matters. Validators physically closer to RPC nodes, MEV searchers, and user traffic sources benefit from lower latency and higher transaction landing probability.
This proximity advantage translates into denser traffic and better block rewards. For reference see here.
The Gold Standard for Measuring Reward Efficiency
Even with the time-dependent approach, external factors, such as stake, client, and geography, still matter. However, these are costly to change and hard to quantify precisely.
That’s why the true gold standard metric is not absolute rewards, but efficiency vs. potential.
In short: Compare what you could have earned (maximum potential reward) with what you actually earned.
This maximum potential can be estimated through post-processing transactions from your TPU pipeline during your leader turns.
Using trace data for this provides a highly reliable view of real traffic conditions and the upper limit of achievable rewards.
By comparing actual rewards vs. potential rewards, validators can identify the efficiency gap — the portion of value lost to scheduling inefficiencies, latency, or missed transactions.
Conclusion + Action
Accurately measuring validator performance isn’t just about counting rewards — it’s about understanding the forces that drive them.
By adopting a time-dependent, traffic-aware approach, we replace assumptions with measurable, repeatable insights that truly reflect validator behaviour in real network conditions.
The gold standard of performance tracking lies in a simple principle: measure efficiency against potential, not just what was earned, but what could have been earned.
This perspective enables continuous optimization, fair benchmarking, and a data-driven foundation for the entire Solana validator ecosystem.
At Exo, we’ve integrated this time-dependent analysis into our infrastructure, ensuring that every validator we operate, as well as those we’ll build for future clients, are engineered for performance, reliability, and transparent excellence.
